New findings: Median ecommerce page has slowed down by 21% in the past year
It’s the first quarter of 2014, which means it’s time for Radware’s quarterly state of the union for ecommerce web performance. The full report is available for download, but first, here’s a high-level preview of some of our findings.
Background: How and why we do this research
Every three months, we measure and analyze the performance of the top 500 retail websites, as ranked by Alexa. Using WebPagetest, a synthetic tool that simulates page load from a real user’s perspective across browser types, we test the home page of each site nine times and record the median numbers for metrics such as page size, composition, load time, start render time, and adoption of performance best practices.
The purpose of this research is threefold:
- to gain ongoing visibility into the real-world performance of leading ecommerce sites
- to learn how these sites perform for visitors sitting at home using the internet under normal browsing conditions, and
- to identify recurring and new performance trends.
Key findings: Pages are bigger, heavier, and slower
If you’ve been following this blog and/or our previous SOTU reports, then you won’t be shocked to hear that we found that pages have changed — and not for the better, performance-wise — since this time last year.
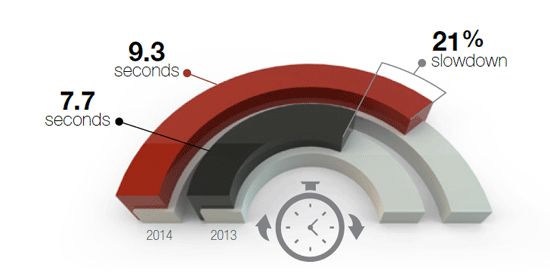
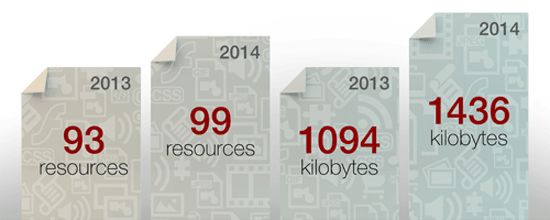
The median page is bigger (99 resources vs. 93 resources), heavier (1436 KB vs. 1094 KB), and slower (9.3s vs. 7.7s load times).
What about the most important user experience metric: Time to Interact (TTI)?
You could argue that heftier pages aren’t a big deal because networks and browsers have evolved to a point where not only can they compensate for page growth, they can deliver ever-faster pages despite page growth. The increase in median load time belies that.
From there, you could argue that the increase in median load time isn’t an especially meaningful metric, and from a usability perspective, you’d be right. Load time is a useful metric for understanding how the sum total of all page resources load, and for identifying potential problems with said resources, but it’s not a UX metric. That’s because load time can be affected by a number of factors, such as third-party scripts loading in the background, which don’t affect the user experience.
This is why, to my thinking, the most interesting and important number to be gathered from this research is the Time to Interact (TTI), defined as the point at which a page’s primary content has rendered and becomes interactive.
To identify the TTI for the top 100 retail sites, we generated a timed filmstrip view of the median page load for each site. This is a fantastic WebPagetest feature that doesn’t get used nearly often enough. The filmstrip allows you to pinpoint the order in which each object renders. It gives a fascinating bird’s eye view of a page’s performance roadblocks. An example:

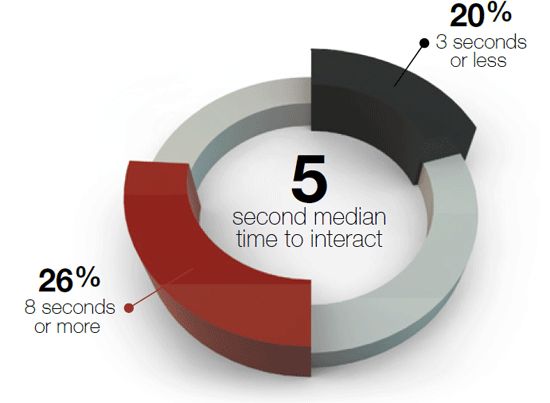
After analyzing the median filmstrip for each home page, we found that:
- The median TTI for the top 100 sites was 5 seconds.
- Only 20% had a TTI of 3 seconds or less.
- 26% took 8 seconds or more to become interactive.
The good news: TTI has improved somewhat
We started measuring and tracking TTI last summer. At the time, we found the median site had a TTI of 4.9 seconds. In our Fall 2013 report, we found this number had increased to 5.3 seconds. At the time, we wondered if this somewhat alarming rise indicated a longer trend. It’s a relief to learn otherwise (for this quarter, at any rate).
The bad news: 5 seconds is still much too slow
While it’s comforting to see TTI settle down to 5 seconds, it’s important to remind ourselves that 5 seconds is still a far cry short of 3 seconds — the point at which the majority of online shoppers say they’ll abandon a page.
More bad news: Many pages are plagued with other usability issues
A significant number of pages suffered from usability issues such as long page delays with completely empty browser windows, pop-ups that obscure the page before it fully renders, and call-to-action buttons that are the last above-the-fold object to render.
Takeaway
While TTI has improved since our last quarterly report, there is still a lot of room for improvement. To take a glass-half-full attitude, this represents a great opportunity for site owners who are ready to take the lead in delivering faster TTI for their shoppers.
DOWNLOAD: State of the Union: Ecommerce Page Speed & Web Performance (Winter 2013-14)


