Why does a typical ecommerce page take 6.5 seconds to load primary content?
Every quarter at Radware, we release a new “state of the union” report, with key findings about the web performance of the world’s most popular ecommerce sites.
Every quarter, we find that the median top 100 ecommerce site takes longer to render feature content than it took the previous quarter.
Every quarter, we field the question: But how could this possibly be happening? Networks, browsers, hardware… they’re all getting better, aren’t they?
The answer to this question is: Pages are slower because they’re bigger, fatter, and more complex than ever. Size and complexity comes with a performance price tag, and that price tag gets steeper every year.
In this post, I’m going to walk through a few of the key findings from our latest report. Then I’m going to share a few examples of practices that are responsible for this downward performance trend.
First, some background
Since 2010, we’ve been measuring and analyzing the performance of the top 500 online retailers (as ranked by Alexa.com). We look at web page metrics such as load time, time to interact (the amount of time it takes for a page to render its feature “above the fold” content), page size, page composition, and adoption of performance best practices. Our goal is to obtain a real-world “shopper’s eye view” of the performance of leading sites, and to track how this performance changes over time. We release the results four times a year in quarterly “state of the union” reports. (You can see a partial archive of past reports here.)
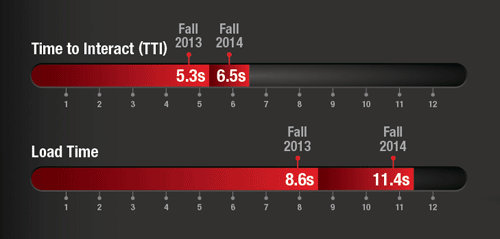
Finding 1: The median page takes 6.5 seconds to render feature content, and 11.4 seconds to fully load.

If you care about the user experience, then Time to Interact (TTI) is a metric you should care about. TTI is the amount of time it takes for a page to download and display its primary content. (On ecommerce sites, primary content is usually some kind of feature banner or hero image.) Most consumers say they expect pages to load in 3 seconds or less, so this sets the bar for TTI.
We found the median top 100 ecommerce page has a Time to Interact of 6.5 seconds — more than twice as slow as the ideal TTI of 3 seconds. This means that when a visitor comes to that median page, this is what she or he sees (rendered in a timed filmstrip view, one of my favourite WebPagetest features):

Finding 2: The median page has slowed down by 23% in just one year.
Not only is this much slower than users expect, it’s gotten slower over time. In our Fall 2013 report, we found that the median page had a TTI of 5.3 seconds. In other words, the median page has slowed down by 23%. That’s a huge increase.
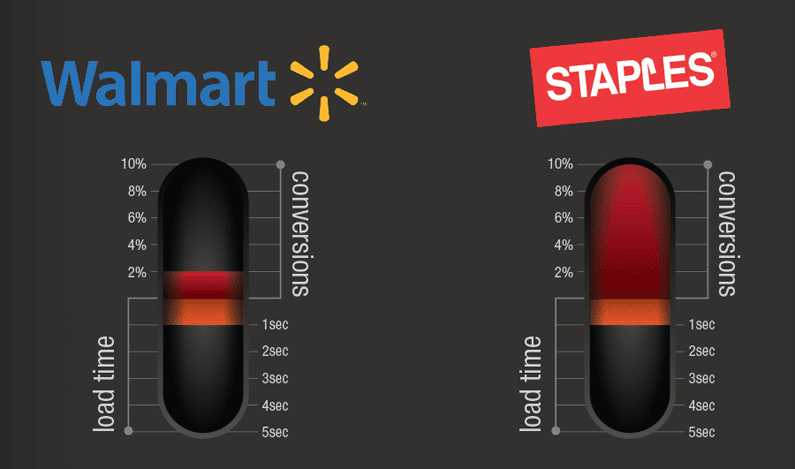
Case study after case study has proven to us that, when it comes to page speed, every second counts. Walmart found that, for every 1 second of performance improvement, they experienced up to a 2% conversion increase. Even more dramatically, at the recent Velocity NY conference, Staples shared that shaving just 1 second off their median load time yielded a 10% conversion increase.

Finding 3: “Page bloat” continues to be rampant.
This finding is consistent quarter over quarter: pages keep getting bigger, both in terms of payload and number of resources. With a payload of 1492 KB, the median page is 19% larger than it was one year ago.

Looking at page size is focusing on just one part of the problem. In my opinion, page complexity is arguably a much bigger problem than page size. To understand why, you need to know that while 1492 KB is a pretty hefty payload, this number is actually down considerably from the peak payload of 1677 KB we reported three months ago, in our Summer 2013 state of the union. At that time, the median page contained 100 resource requests, fewer than the current median of 106 resources. So the median page today is significantly smaller but has 6% more resources than it did three months ago. Here’s what that means…
Some of the most common performance culprits
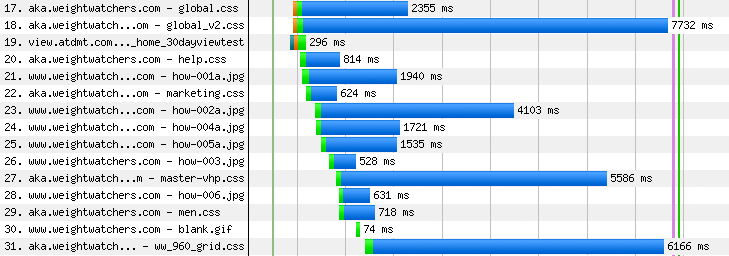
Every resource request introduces incremental performance slowdown, as well as the risk of page failure. Let me illustrate with waterfall snippets showing a few real-world examples. (If you’re new to waterfall charts, here’s a tutorial on how to read them. TL:DR version: long blue bars are bad.)
Before you look at these, I want to point out that the goal here is not to publicly shame any of these site owners. Not only are these examples typical of what you might find on many ecommerce sites, they’re most definitely not the most egregious examples I’ve seen. I chose them specifically because of how typical they are.
1. Hero images that take too long to download.

2. Stylesheets that take too long to download and parse. Stylesheets that are improperly placed and block the page from rendering.

3. Custom fonts that require huge amounts of CSS, or heavy Javascript, or are hosted externally.
![]()
4. Poorly implemented responsive design. (Related to 2, but merits its own callout given the popularity of RWD.)

Takeaway
Back when I started using the web, you could make pages any colour you wanted, as long as that colour was grey. I still remember the excitement I felt the very first time I was able to use colour on the background of a page. (It was yellow, if you’re wondering.) I remember when the <center> tag came along. And good golly, I remember when we were first able to add images to pages. That was a heady (and animated gif-filled) time.
Sure, pages used to be leaner and faster. They also used to look really, really boring. I don’t long for the return of a grey, graphic-less web.
This is all to say that I love images, stylesheets, custom fonts, and responsive design. They give designers and developers unprecedented control over the look and feel of web pages. They make pages more beautiful across an ever-increasing number of platforms and devices. But they can also inflict massive performance penalties — penalties that cannot be completely mitigated by faster browsers, networks, and gadgets. And this impact is increasing, rather than decreasing, over time.
As site owners, designers, developers, UX professionals, or whatever your role is, we need to be mindful of this. Performance is the responsibility of every single person who touches a web page, from conception through to launch.
