The 12 most popular web performance posts of 2014
In 2014, people seemed most interested in mobile performance, image optimization, improving perceived performance, and page growth and slowdown trends. This year-end look through Google Analytics was a lot of fun for me. I hope you enjoy it, too.
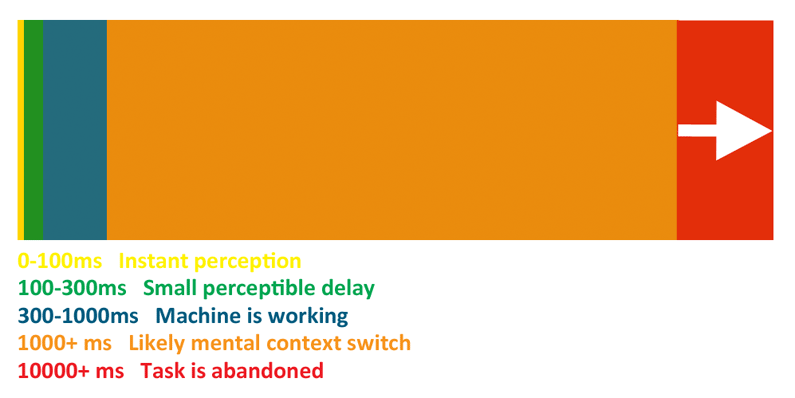
1. How to create the illusion of faster web pages (while also creating happier users)
When you consider how many things need to happen before anything begins to appear in the browser — from DNS lookup and TCP connection to parsing HTML, downloading stylesheets, and executing JavaScript — 1-second render times seem like an impossible dream. Here are eight tricks and techniques you can use to improve perceived web performance. READ MORE >
2. Stop the presses: Has the average web page actually gotten SMALLER?
Last spring, HTTP Archive data yielded a surprising first: web pages actually shrank, rather than grew. This post looks at the data and discusses whether this finding is a new trend or just a statistical blip. READ MORE >
3. New findings: For top ecommerce sites, mobile web performance is wildly inconsistent
Mobile has never been more crucial to business success than it is right now. More than half of all time spent on retail sites takes place on a mobile device. The average online shopper makes 6.2 visits to a company’s website, using 2.6 devices, before they buy. And just a one-second delay in mobile load times can hurt conversions and cart size by up to 3.5%. This is why sites need to perform quickly and consistently across all platforms.
This is why it’s critical for site owners to have visibility into the real-world mobile performance of their sites. And this is why, every year at Radware, we study the mobile performance of the top 100 ecommerce sites to see how they measure up to user expectations. This post shares key findings and takeaways from Radware’s annual State of the Union for Ecommerce Mobile Web Performance. READ MORE >
4. 9 awesome posts about web performance (that I wish I’d written)
For every post I write about performance, there are dozens that I read. Every so often, I read one that makes me clutch my (metaphorical) pearls and wish I’d written it myself. Here’s a batch of I-wish-I’d-written-that posts by people you should be following, if you aren’t already. READ MORE >
5. Waterfalls 101: How to use a waterfall chart to diagnose your website’s performance pains
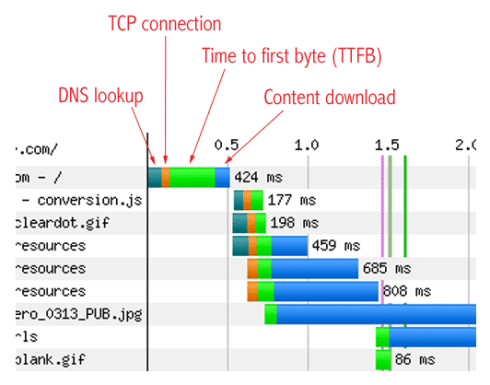 A waterfall chart is any diagram that represents data that is generated cumulatively and sequentially across a process. A performance-specific waterfall chart lets you see the series of actions that occur between a user and your server in order for that user to view a specific individual page of your site.
Waterfall charts can look daunting to performance newbies, but they’re an essential tool for understanding and addressing performance issues. This post is for people who want to crack the hood and learn why pages behave the way they do, how to begin to diagnose performance issues before sending out red-flag emails to everyone on your team, and how to talk performance with the experts within your organization who do live and breathe waterfalls. READ MORE >
6. How Does Web Page Speed Affect Conversions? [INFOGRAPHIC]
Performance has only recently started to make headway into the conversion rate optimization (CRO) space. These inroads are long overdue, but still, it’s good to see movement. This collection of infographics represents real-world examples of the huge impact of page speed on conversions. READ MORE >
7. 12 websites that prove RWD and performance CAN play well together
Last spring, a Keynote mobile index report found that only two out of the 30 sites in the index use responsive design, and both those sites took 17+ seconds to load on mobile devices. This sparked a lot of online discussion about the challenges of making fast responsive pages, with some folks taking the stance that RWD and performance don’t play well together. (This isn’t a new opinion, and it’s sparked a lot of debate in the past. See this post from Tim Kadlec for an excellent example.)
I decided to look at 60 acclaimed examples of responsively designed sites to see how well they perform in a typical desktop scenario. While only 80% of the pages I looked at took 7 seconds or longer to load, the other 20% did prove that RWD can be fast. No excuses. READ MORE >
8. There are more mobile-optimized sites than ever. So why are mobile pages getting bigger?
This post was the result of my first dive into the Mobile HTTP Archive, the mobile counterpoint to the HTTP Archive. The Mobile HTTP Archive tests the same list of URLs, but it does so using smartphones. This means that if a URL redirects to a mobile site, the Archive tests the mobile site. What I found won’t come as a surprise to anyone who’s been following this blog for a while. While there are many similarities between the HTTP Archive’s mobile and desktop data, there are also a number of insights that are unique to mobile devices. READ MORE >
9. What the 10 fastest ecommerce sites can teach us about web performance
After releasing our quarterly state of the union for ecommerce performance last summer, I thought it would be interesting to take a look at the ten fastest sites and the ten slowest sites and see what they have in common, where they differ, and what insights we can derive from this. Lessons learned: Faster web pages are smaller, contain fewer resources, and know what content to defer. READ MORE >
10. The Real Cost of Slow Time vs Downtime [SLIDES]
Last month, I had the pleasure of being invited to speak at the CMG’s annual Performance & Capacity Conference. One of my sessions was a brand-new talk that I’m frankly kind of surprised I’ve never done before: a shallow dive into the topic of measuring the financial impact of slow performance versus the financial impact of outages. This set of slides offers a pair of formulas for estimating short- and long-term losses to your site caused by slow page load times and sub-optimal web performance. READ MORE >
11. Progressive image rendering: Good or evil?
Which offers a better user experience: baseline or progressive images? We took this question to the neuroscience lab to find the answer. To be frank, the results surprised even us, and they triggered a bunch of new questions. READ MORE >
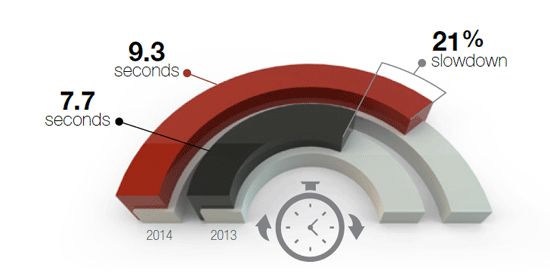
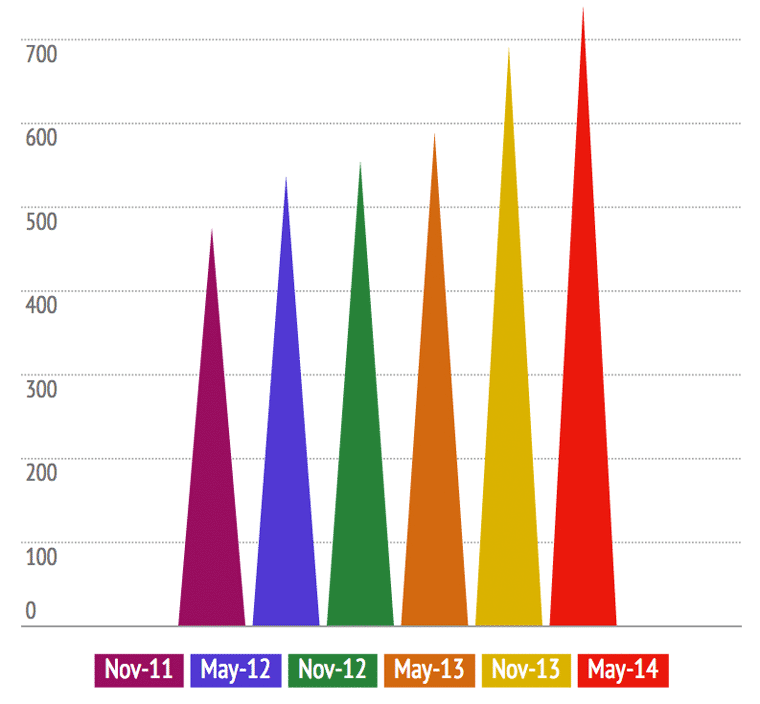
12. The Great Web Slowdown [INFOGRAPHIC]
I really like this poster-style infographic that illustrates how and why pages are getting slower rather than faster, and the impact this has on business metrics. A lot of other people liked it, too. I hope you do, as well. READ MORE >